Version 2021-4-20
![]() Published Apr 25, 2021
Published Apr 25, 2021
Insights
The April release includes some exciting visualizations of the on-board controller data
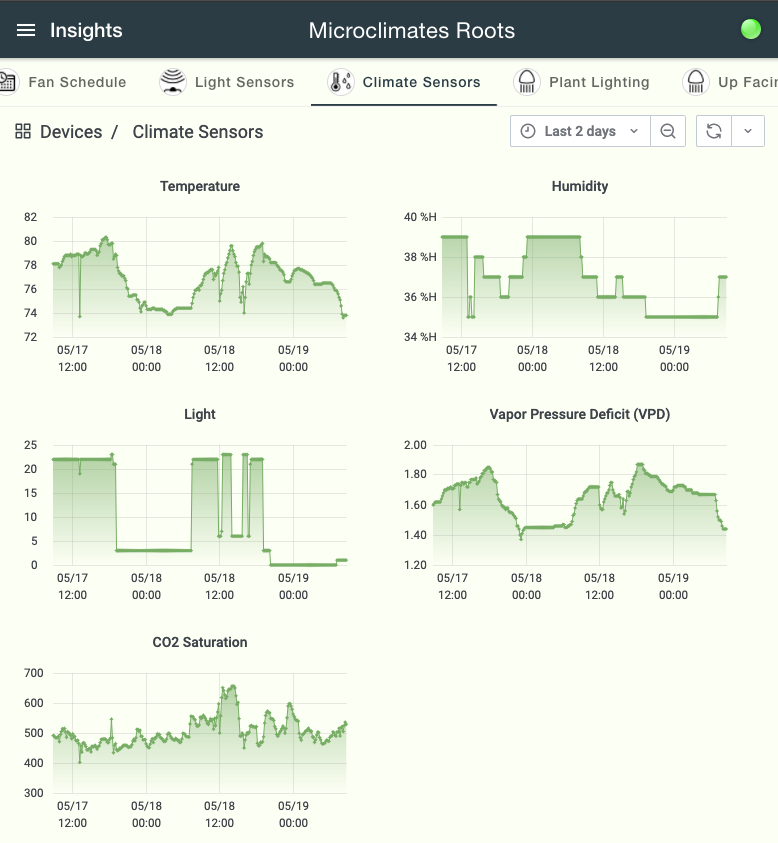
When the Insights menu item is selected, you’ll see a scroll bar at the top with every card in your controller. Each card now includes an insights dashboard for the data it produces.
Metrics
The top portion of each insights dashboard displays the most relevant card data.
Controller Health
The Home tab controller health in the three most important categories - CPU, Memory, and Disk Space. It’s important to keep an eye on these metrics to assure your controller is performing well.

History
Some dashboards let you expand sections for more details, like the History section on the controller Home dashboard.

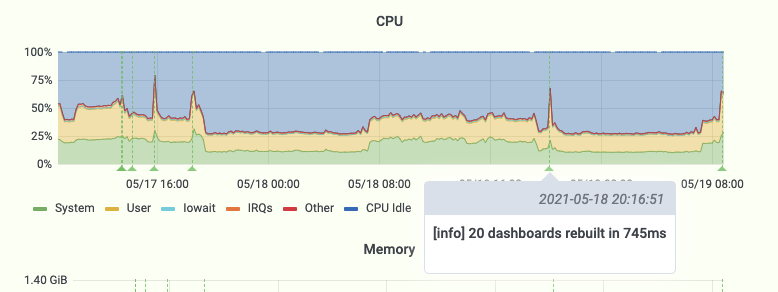
Annotations
Vertical lines in a chart represent notes made by the program. The line color indicates a general note, a warning, or an error.
Hovering over the triangle at the bottom expands the annotation. In the image below, the note explains that dashboards were rebuilt - something that happens when the controller is restarted. That helps understand the reason for this spike in CPU usage.
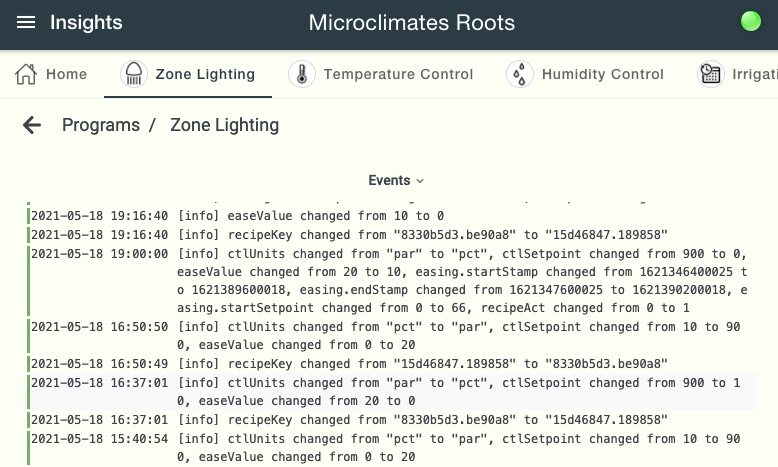
Event Logs
Most dashboards contain an event log section near the bottom. These logs contain details about changes made to the card, warning and error events, and other information about the card that the program outputs.
They can get a bit technical, but can help identify issues.
Data Export
Each chart contains a menu with additional features. Selecting the Inspect/Data menu opens a screen that lets you export the chart data to a file suitable for importing into a spreadsheet.

